RNA-Seq (RNA sequencing) is a technique that can examine the quantity and sequences of RNA in a sample using next generation sequencing (NGS).
It analyzes the transcriptome of gene expression patterns encoded within the RNA.
The following are the steps we follow in a usual RNA-seq data analysis; both reference-based and de novo
assembly-based protocols are mentioned below:
A. When a reference genome is available
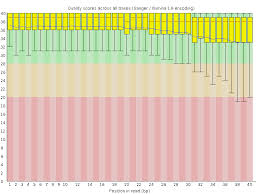
Step 1 - Quality Control/Trimming
Adapter removal, trimming, pooling of samples
Figure #1: Read Quality
Step 2 - Read Alignment
Reads mapping with TopHat2 (or another aligner at request)
Step 3 - Expression Quantification:
Generation of counts table of raw reads mapped based on chosen annotation feature (genes, exons, intergenic regions, etc.)
Conversion of read counts into RPKM values (FPKM for paired-end data)
Step 4 - Sample Tree (Correlation Analysis)
Step 5 - Differential Expression (DE) Testing
Statistical identification of differentially expressed genes (DEGs) with edgeR or DESeq2
PCA plots, Venn diagram
Gene clustering and heatmaps
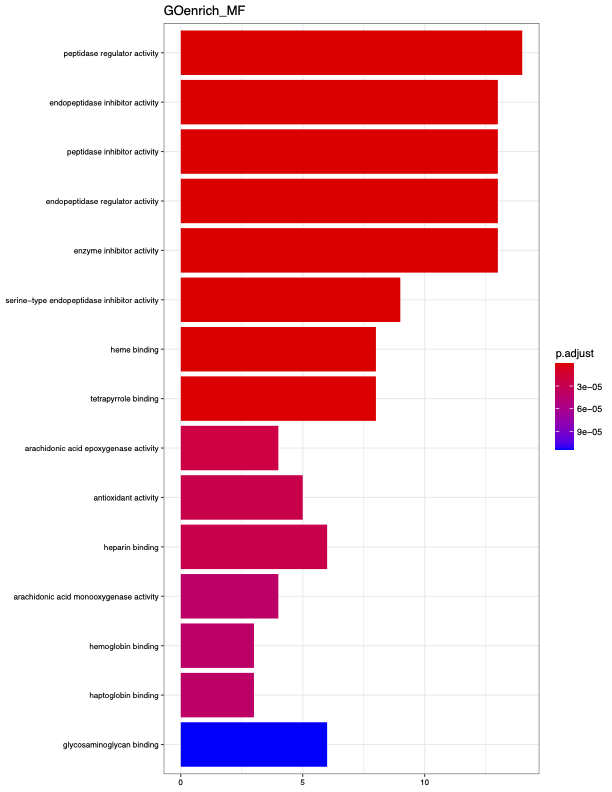
Figure #2: GO Enrichment
Step 6 - Functional Interpretation:
Gene Ontology (GO) term enrichment analysis
KEGG pathway analysis
Note: alignment files (*.bam) can be provided at request for visualizing read mappings, analysis
results and annotation data, e.g. on the IGV genome browser
B. When a Reference Genome is Not Available
Step 1 - Quality Control/Trimming
Adapter removal, trimming, pooling of samples
Step 2 - Assemble Reads de novo to Construct Reference Genome
Reads mapping with trinity, bowtie, another aligner if requested.
Step 3 - Assessing assembly quality
Alignment summary metrics
Step 4 - Expression Quantification
Generation of counts table of raw reads mapped based on chosen annotation feature (genes, exons, etc.)
Conversion of read counts into RPKM values (FPKM for paired-end data)
Step 5 - Sample Tree (Correlation Analysis)
Step 6 - Differential Expression (DE) Testing
Statistical identification of differentially expressed genes (DEGs) with edgeR or DESeq2
At USU’s high-performance computing and bioinformatics facility, we have developed a series of parallel, multicore, CPU-based,
open-source pipelines for large-scale -omics data analysis, which enables efficient and parallel analysis of multiple datasets
in a short period of time.